
Machine Learning Project: American Sign Language Recognition Using Support Vector Machine
Introduction
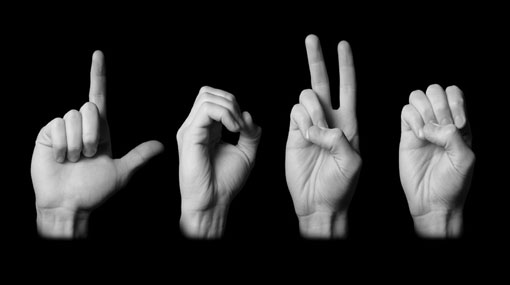
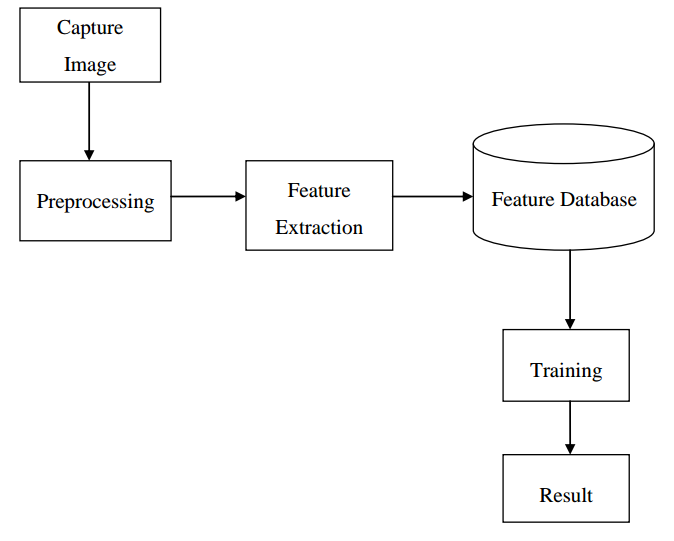
American sign language (ASL) recognition is a task of understanding signs made by challenging people. Therefore, a signer can make a sign and the other person can understand. The main objective of ASL recognition is interpretation of images which describes hand sign created by user. Sign language recognition system deals with capturing of image through electronic device. The input mode is video sensor device such as webcam. The Sign Language recognition system is having goal to analyze image and give as output the corresponding text. The main problem occurs in system is recognition of images. It is difficult to work on images. Thus image processing is done. The interest of this project is to evaluate the accuracy of sign recognition. To archive this goal, there is a block diagram in which shows the working of the process.
Basic Process of Sign Language Recognition
Image data collection:
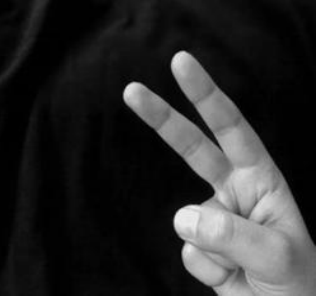
Sign images are collected using webcam. Signs are made using black background. The database is having 23 classes with 10 samples each, i.e. there are 230 total images. Some of sample images are shown below:
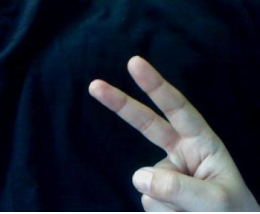

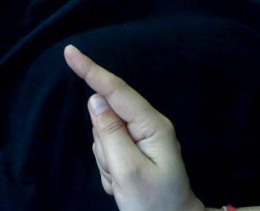
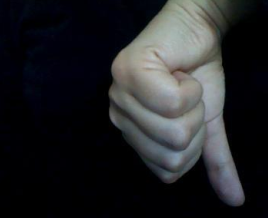
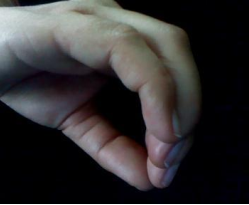
Image processing:
Image processing can be considered as a form of Signal processing. In this, input is an image and output can be a new image itself or a set of parameters related to this image.
Image scaling:
The original RGB image is captured. The RGB image has 3 color planes for each frame. The RGB image is then converted into grayscale image. Then image scaling is applied over image i.e. resize the image. Bicubic interpolation is used for image scaling. Bicubic interpolation considers 16 pixels i.e. 4 by 4 neighborhoods. The image size is changed to [250 250], and provides smoother surfaces than bilinear interpolation and nearest-neighbor interpolation.
Smoothing:
Due to modifications, the resultant image may be having noise and blur. Therefore, filter is used to reduce the effect of noise and blur. Gaussian low pass filter is used here as it reduces high-frequency components of Fourier transform of image. Further effect of Gaussian filter is that it helps in the improvement of results of edge detection algorithm.
Gray Scale Image
Canny Edge Detection:
In an image, edge is a local feature that separates two regions within a neighborhood. This separation is based on the difference of intensity in the image. Before applying canny edge detection, a threshold value is calculated. The threshold function is based on Otsu’s method which chooses threshold for minimizing interclass variance between black and white pixels.
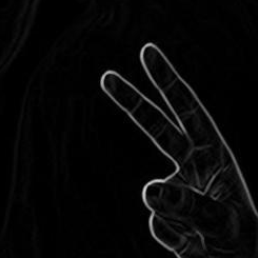
Canny edge detector is used to detect a range of edges in images using multiple stage algorithm. It first derivative having noise cleaning and the accuracy is improved by using noise smoothing. The result is blurred version of original image. Another stage is to find the intensity gradient of the image. It uses four filters to detect vertical, diagonal and horizontal edges in blurred image. The figure below shows the result of canny edge detection.

Canny Edge Detection
Improved Sobel Edge Detection:
Improved sobel edge detector is a combination of sobel operator, dilation, and erosion.
Dilation and erosion are morphological operations that process image based on shapes. These operations apply structure elements to an input image and create a same-sized output image. In output image, the value of each pixel is obtained by comparison of corresponding pixel of input image and its neighbor. Dilation is used to add pixels to the object boundaries in image and Erosion removes pixels from object boundaries. The decision on number of pixels to be added or deleted depends upon size and shape of structuring element.
Dilated and Eroded Image
To smooth the image, open and close operation are performed. Open operation is applying erosion followed by dilation. Close operation is applying dilation followed by erosion. Then sobel edge detection operator is applied on the resulting image. The whole process is to enhance sobel edge detection.

Improved Sobel Edge Detected Image
Feature Extraction:
The output of canny edge detection is used to get features. The technique used is Zone based approach [1]. The algorithm works in following steps:
- Image of size [250 250] is divided into 100 zones. Each zone has size of 25x25.
- The mean and standard deviation for each zone are calculated. Each image has 100 features, respectively.
- Features for all the samples are extracted and stored in three datasets. One dataset named Data-mean has all the zonal means of image as {M1; M2; M3;…; M100}. For dataset named Data-std, all the zonal standard deviations are stored as {σ1; σ2;…; σ100}. Third dataset named Data-MeS stores mean followed by standard deviation as {M1, σ1; M2, σ2;…; M100, σ100}.
Pattern Recognition using SVM:
Support Vector Machine is one of the supervised learning model having associated learning algorithm. SVMs are used for analysis of data and recognition patterns, and are applied for classification and regression analysis. SVM belongs to broad family of kernel based learning algorithms.
SVM Algorithm
SVMs maximize the margin around separating hyperplane. The decision function specified with the support vectors, which are subset of training samples.
Support vectors: The data points which are closest to the decision surface are called support vectors. It is the very difficult task to classify them.
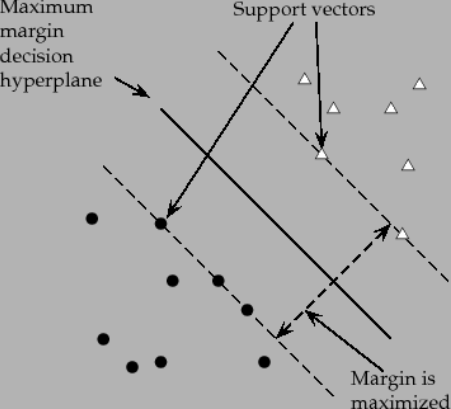
Support vectors
There are mainly two types of SVMs:
- Linear Support Vector Machine
- Non Linear Support Vector Machine
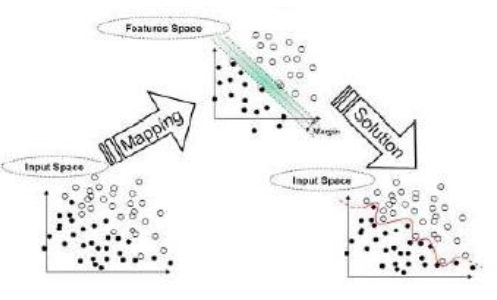
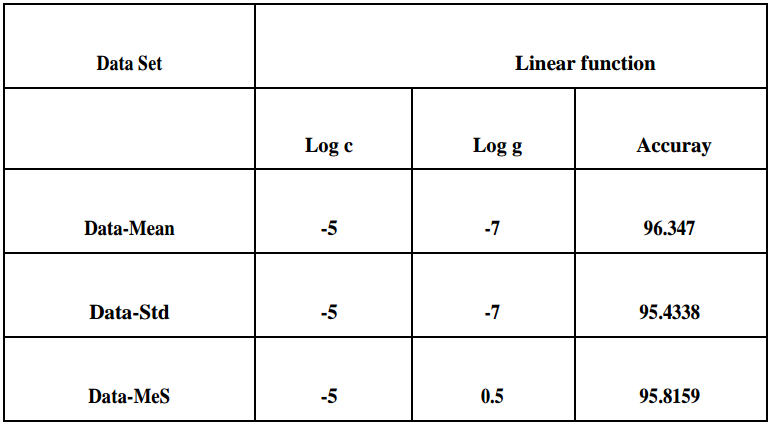
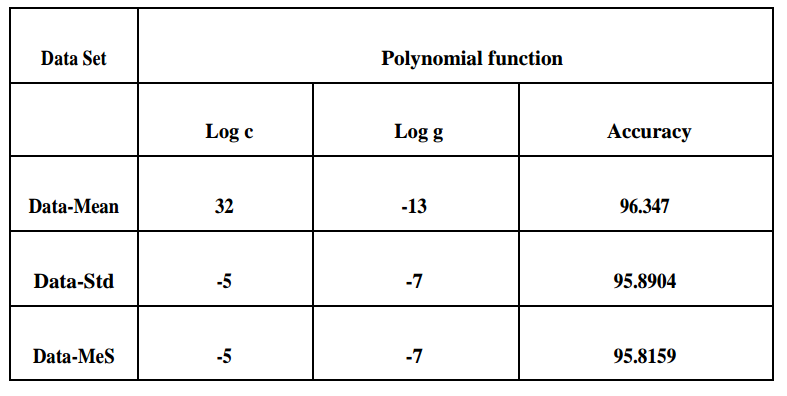
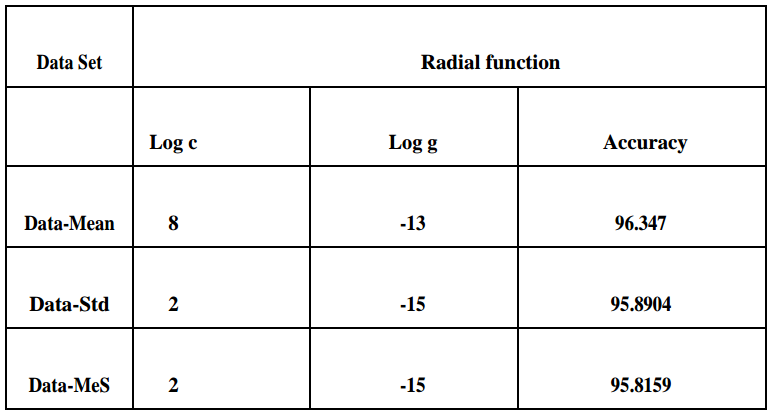
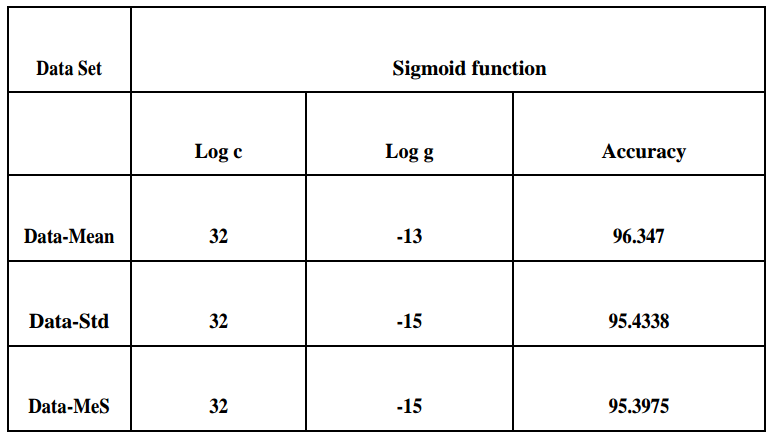
Fundamental idea of SVM is optimal hyper-plane for linear separable patterns. In case of not linearly separable patterns, it transforms original data map into new space that is a kernel function. For more details of how SVM works : SVM algorithm. The accuracy obtained by kernel functions is shown in following tables. In the table below, log c and log g are parameters representing logarithmic values of cost and gamma respectively. Three datasets are taken: Data-Mean, Data-Std, and Data_MeS.
Conclusions:
In this project, sign language images are analyzed. The input are American sign language images. After applying canny edge detection as a feature extraction step, three datasets are fed into SVM classifier for the training purpose and are evaluated to find the best accuracy obtained. As regards to the results, the accuracy over Data-Mean is the highest.
References:
[1] Deng, Caixia, Weifeng Ma, and Yin Yin, “An edge detection approach of image fusion based on improved Sobel operator”, Image and Signal Processing (CISP), 2011 4th International Congress on. Vol.3, IEEE, 2011.